Introduction
tglow-pipeline is a Nextflow pipeline for processing high-content imaging (HCI)
plates, from raw Revity/PerkinElmer exports from the Opera Phenix or the
Operetta to single-cell features. It also accepts any other OME-TIFFs organised
in a <plate>/<row>/<col>/<field>.ome.tiff structure with CZYX channel order
(see Staging data).
The pipeline handles flatfield correction, multi-cycle registration, deconvolution, Cellpose segmentation, channel demultiplexing, intensity scaling and CellProfiler-based feature extraction. It additionally outputs processed images that can be visualised in Napari or other viewers, cell crops that can be used for visualisation in R or for training deep learning models, and an HTML QC report.
Check out our preprint: bioRxiv 2026.02.10.704860
The pipeline is one of three components:
- tglow-pipeline: the Nextflow workflows and Python scripts documented here.
- tglow-core: Python library with the image I/O, parsing and helper functions the pipeline uses.
- tglow-r: Seurat-like R package for analysing the features the pipeline produces.
Guide
- Installation
- Manifests and configuration
- Staging data
- Running the pipeline
- Configuring CellProfiler
- Scaling
- QC report
- Understanding output
- Cleaning up old runs
- Finalizing results
- Analysing features in R
Reference: Parameters · FAQ · Known issues · Changelog
Upgrading from v0.0.1-beta? Channel numbers are now 0-indexed everywhere, many parameters were renamed and the pipeline now rejects unknown parameters. Read the migration notes before re-running an existing project.
Pipeline overview
The pipeline has two workflows, selected with --workflow:
stageconverts a Revity/PerkinElmer export into one OME-TIFF per field, organised as<plate>/<row>/<col>/<field>.ome.tiff, and records the plate metadata. You can skip it if you organise your images in this layout yourself.run_pipelineprocesses the staged images. Most steps are optional and switched on or off through parameters or the manifest.
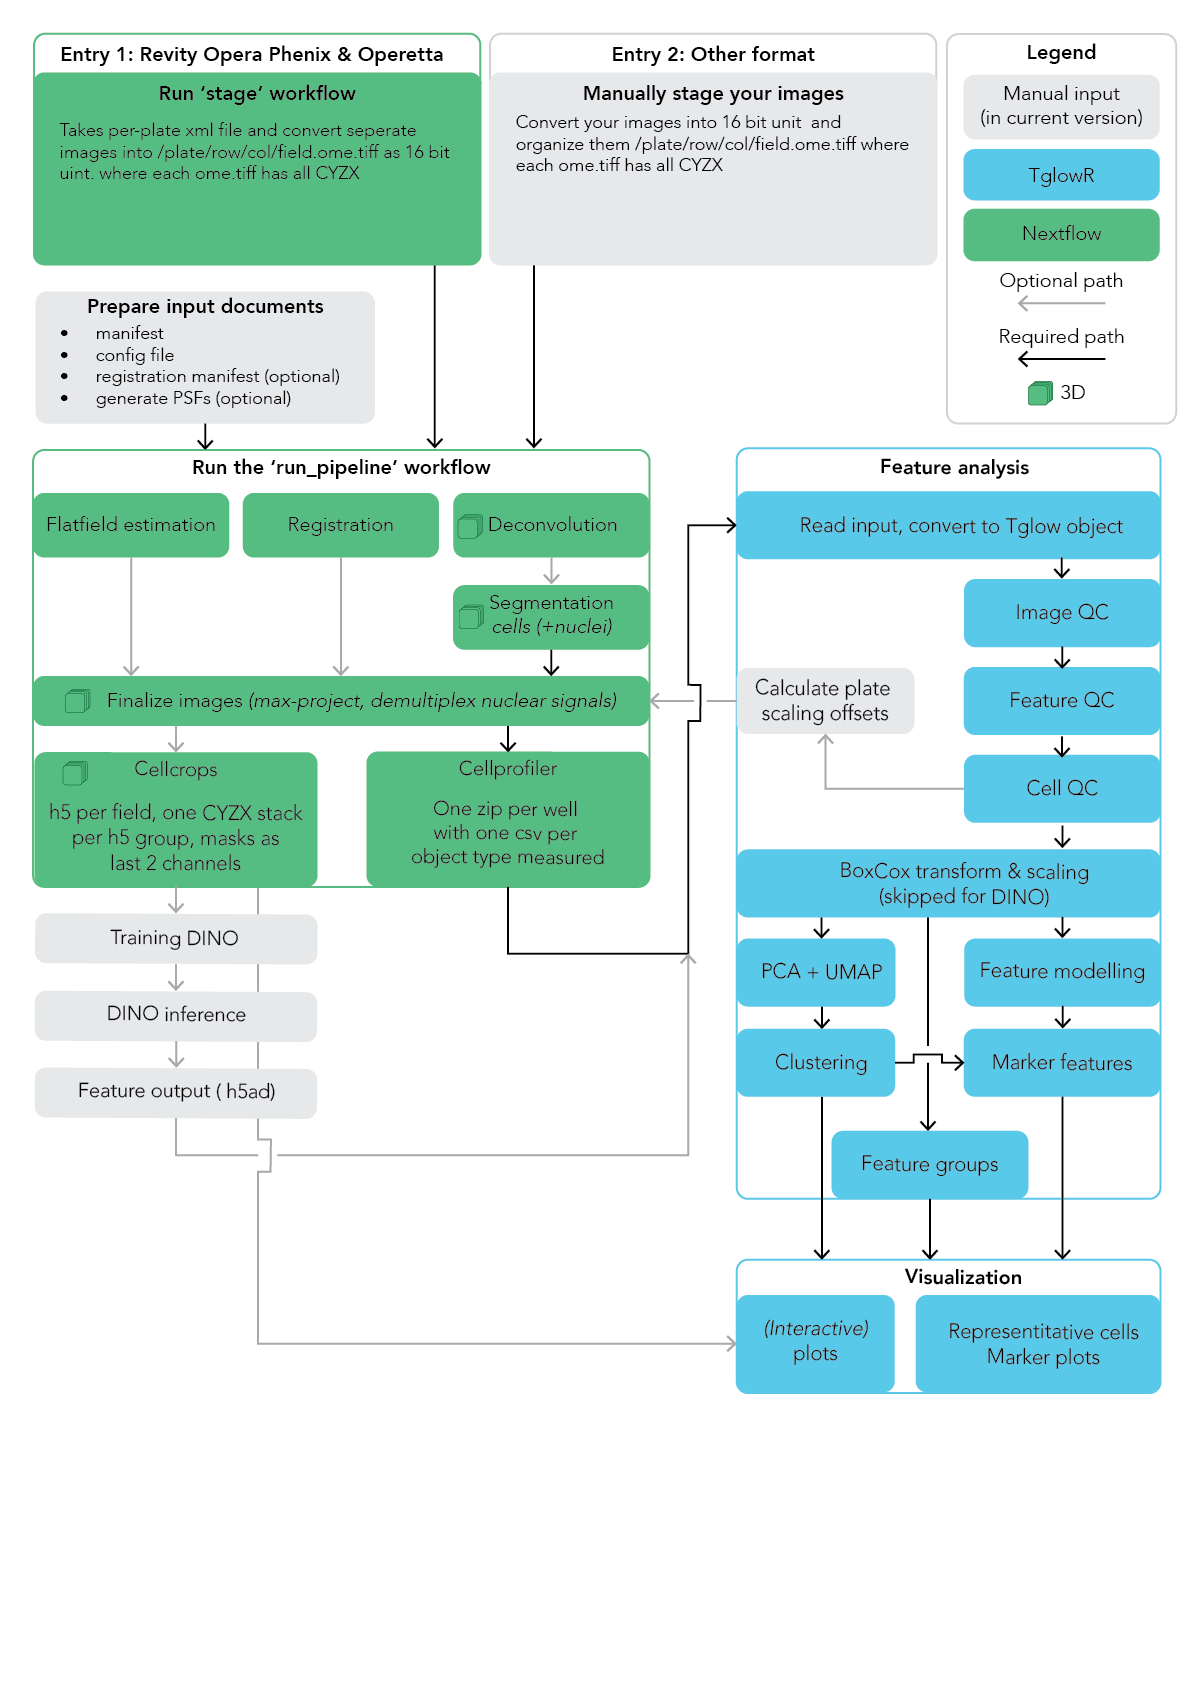
This diagram predates v0.2.0. Plate scaling offsets are now calculated inside the pipeline (see Scaling) rather than in R, and the QC report is not shown.
The main steps of run_pipeline, in the order they typically run:
Design notes
- Two kinds of output folders. The expensive, early steps (images,
flatfields, registration, masks, deconvolution) use Nextflow
storeDiras a permanent cache: if the output exists it is reused, even if parameters changed. Delete or rename these folders to force a re-run. Everything downstream of finalize is published to folders prefixedrr__and re-runs automatically when its inputs change. See Re-running and caching. - Parallelisation is per well, to avoid many short jobs with high overhead (environment activation, Python start-up).
- Field-aware. The pipeline handles fields that are missing in some cycles or plates.
- No stitching. If you need stitched images, stitch before running the pipeline and disable flatfield estimation, which does not work on stitched images.
- HPC first. The pipeline is built for HPC clusters. Segmentation and
deconvolution need GPUs for realistic data sizes. For small tests you can run
locally with
-profile local.